


- Led user workshops to gather feedback.
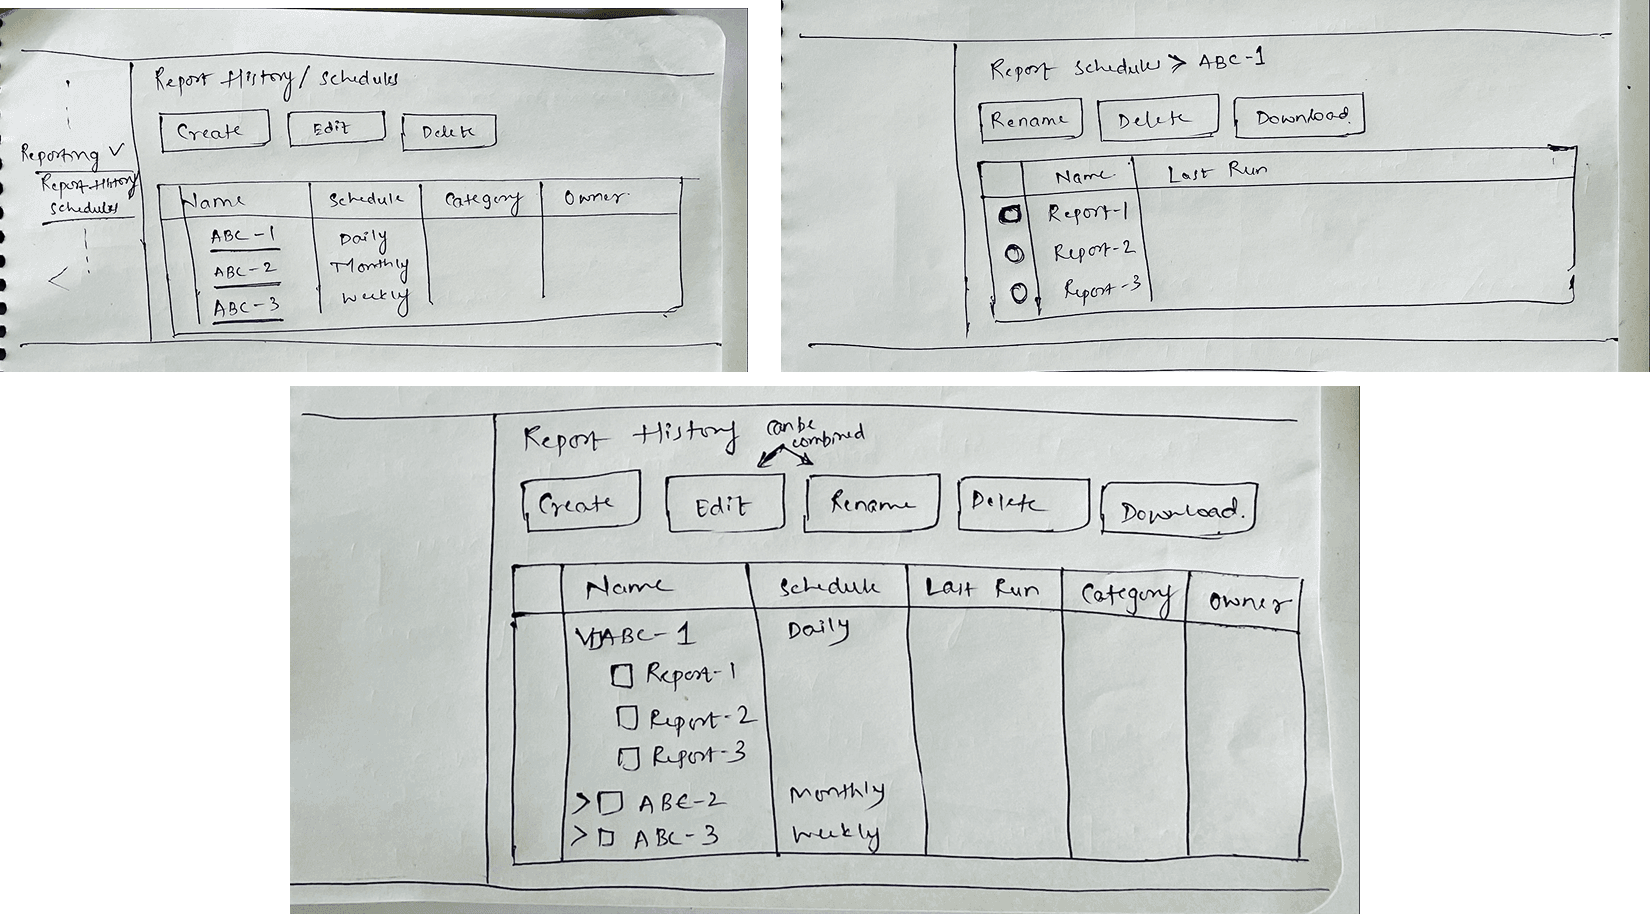
- Redesigned the reporting feature for better usability.
- Created new UI patterns and contributed to the design system.
1
When we spoke with our clients, we uncovered a surprising insight: the PPDM reporting feature was underutilized.
Instead, clients like Walmart, Presidio, and Duke Energy were relying on alternative software solutions like Veeam and DPA to meet their reporting needs.
This highlighted a significant gap - PPDM's reporting feature wasn’t meeting user expectations, pushing them to look elsewhere.
————————
Key issues we identified were:
Unclear Navigation
Confusing terms in navigation items made it hard for users to find reporting features.


Missing Report Previews
Users couldn't preview reports before generating them, leading to wasted time and frustration.


Limited Templates
Only a few pre-made templates were available, making it hard for users to meet their reporting needs quickly.


Inability to Edit Reports
Once created, reports couldn’t be edited or reused, limiting flexibility and efficiency.


————————
Complicated Process & Navigation

Lack of Proper Templates

Missing Basic Functionalities
2


3
Report Preview
See it before you save it - users can now preview their reports in real-time, saving time and avoiding errors.


Report Download
Simplified downloading - choose formats like CSV or PDF effortlessly with just a few clicks.


Template Creation
Personalization made simple—users can now create and save customized templates for recurring needs.


Report Customization
Flexibility at its core - users can edit existing reports on the fly to suit their specific requirements.


